IVML
Angular.js directives for data visualization with d3.js
IVML is a JavaScript library that leverages popular JavaScript technologies Angular, D3 and JQuery. It uses d3js to provide embeddable AngularJS directives for data visualization, greatly reducing the effort required to make interactive dashboards.Examples:
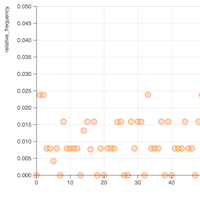
Plotting Points
Scatter plots and dynamically-updating data stuructures.
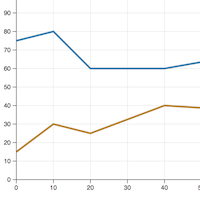
Drawing Lines
Single-line, multi-line and stacked-line charts.
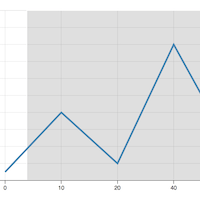
Simple Zooming
Brushes and events.
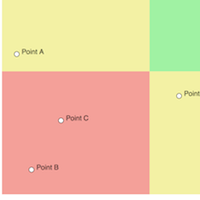
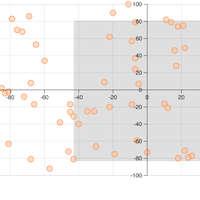
Quad Charts
Axes options, text labels and rectangles.
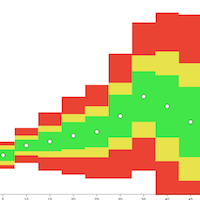
Hurricane Chart
Error bars and multiple visual elements on a plot.
2-Dimensional Zooming
Advanced zooming through brushes.
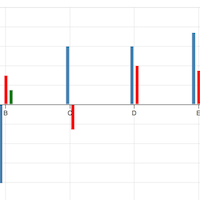
Bar Charts
Stacked and grouped bar charts.

Game of Life
Implementation with very concise JavaScript.